UFC Fight Statistics For Bettors: How To Read The Numbers Behind The Line

Table of Contents
- Reading The Numbers Behind A UFC Line
- The 53% Finish Rate That Shapes Every Method Market
- Why Heavyweight And Flyweight Almost Belong To Different Sports
- Favourite Versus Underdog: What 65% Actually Means
- Rematches And Title Defences: The Patterns That Repeat
- Tape Study And Recent Form: What Doesn’t Show On The Stat Sheet
- Event Context: What Changes At UFC London
- Mapping Statistics Onto Markets You Can Actually Bet
- The Pitfalls Of A Headline Stat
Reading The Numbers Behind A UFC Line
Most UFC betting guides treat statistics as decoration. They list striking accuracy and takedown defence in a sidebar, give you a glossary of what each metric means, and never circle back to how the number actually moves a price. Real ufc fight statistics betting work begins where those guides stop — at the question of how each statistic maps onto a specific market the bookmaker is offering, and how the historical base rate disciplines the decision you’re about to make.
Nine years pricing UFC for British operators has left me with a particular view on which numbers matter, which are noise, and which are the silent base rates that quietly run the whole pricing operation. The finish rate is one. The favourite winrate is another. The divisional skew is a third. None of these is exotic; all of them are public; almost no UK bettor uses them properly. This article is a guided tour of the statistics I actually use to read a UFC line, in the order I use them, and with the connection to a market drawn explicitly in each section.
I’ll start with the most fundamental number — the overall UFC finish rate — and walk through divisional breakdowns, the favourite-versus-underdog patterns, what happens in rematches and title fights, the qualitative factors that show up on tape but not on the stat sheet, the home-crowd effect at UFC London, and a closing map of which statistic feeds which market. Along the way I’ll flag the pitfalls of headline numbers — the small samples, the cherry-picked windows, the false confidence that comes from a percentage with too few decimal places. By the end you should have a working toolkit, not just a glossary.
The 53% Finish Rate That Shapes Every Method Market
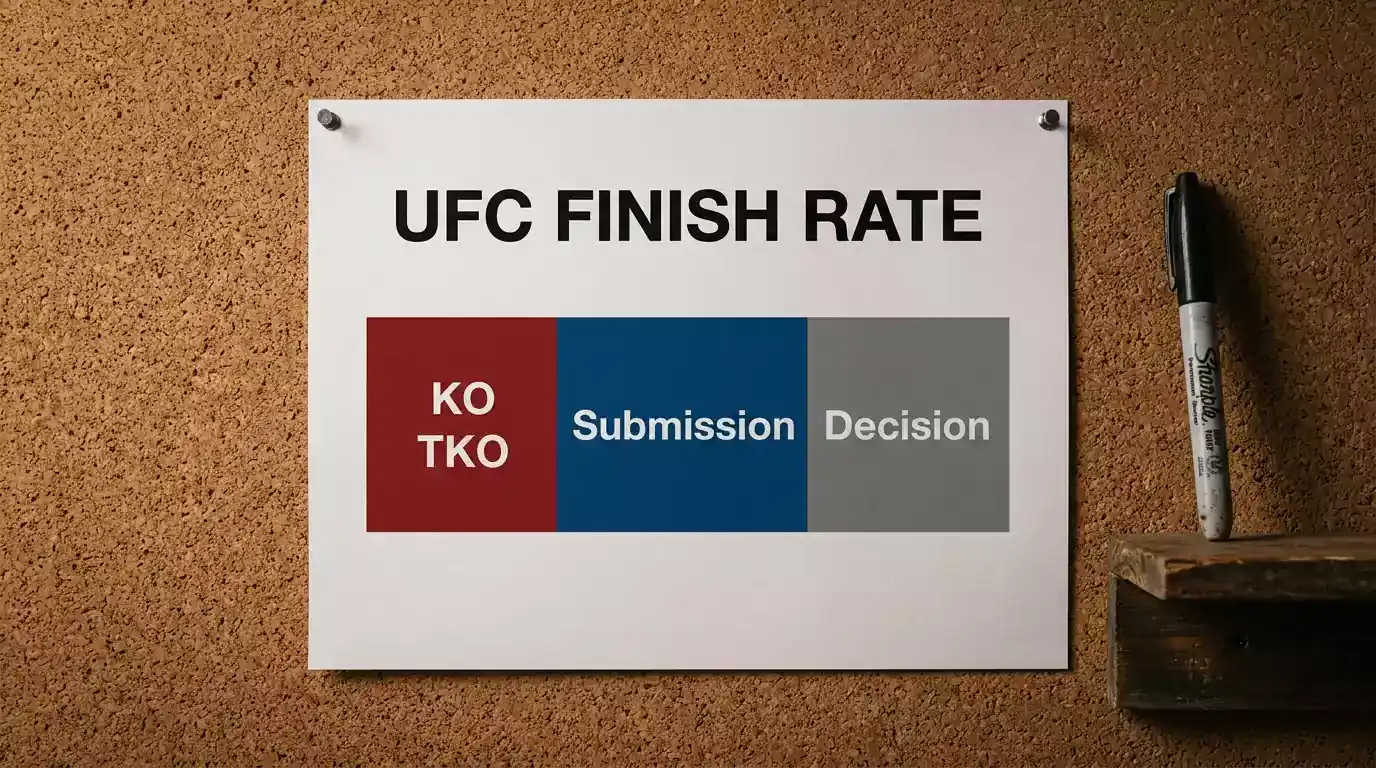
I have a number written on a Post-it stuck to the side of my monitor: 53. That is the single most important statistic in UFC betting, and the one that anchors every method-of-victory price on every UK board. Roughly 53% of all UFC fights end inside the distance. The breakdown: 33.3% by KO/TKO, 19.7% by submission. The remaining 47% go to the judges’ decision.
Why this number matters. Imagine you’re looking at a method market on a typical UFC fight. The bookmaker has priced the favourite to win by KO at 5/2, by submission at 6/1, and by decision at 3/1, with mirror lines for the underdog. The implied probabilities embedded in those prices should add up across all six lanes to roughly 100% plus overround. The base rate tells you the bookmaker’s prior: of every 100 UFC fights, 33 end by KO, 20 by submission, 47 by decision. Allocate that across the two fighters based on the moneyline favourite-favourite split and you’ve reconstructed the linemaker’s starting point.
The disciplined exercise is to ask whether the specific fight you’re betting deserves the base rate, more than it, or less than it. A fight between two aggressive strikers with knockout finishes on their last three records each almost certainly deserves a finish skew above 53% — and the bookmaker will have priced that, with the under-rounds line shorter and the KO method market relatively tighter. A fight between two safe technical wrestlers, both of whom lean on decisions, deserves the opposite skew — and again the bookmaker will have priced it, with the decision market tighter and the KO market wider.
The base rate is the disciplinary anchor. Without it you have no way to tell whether a 5/2 method price is generous or stingy. With it you can ask the precise question — is this fight more or less likely to end by KO than the average UFC fight — and answer with reference to the data rather than the gut. That is the entire mechanism by which statistics turn into bets.
One subtle but important point. The 53% finish rate is the global UFC number across all divisions, both genders, and over a sample large enough to be statistically meaningful. It is not the right anchor for any single fight in isolation — every individual matchup has a more specific divisional base rate, which we’ll get to next. But the global figure is the baseline against which divisional adjustments are measured, and it is the number you should carry in your head whenever you look at a method market.
Why Heavyweight And Flyweight Almost Belong To Different Sports
If the global UFC finish rate is 53%, the divisional spread around it is wider than most bettors realise. Heavyweight and flyweight are the two extremes, and the gap between them is large enough that the same prop bet — say, over/under 2.5 rounds — has a fundamentally different expected outcome depending on which division the fight is happening in.

Heavyweight first. The data here is striking: roughly 50% of all heavyweight UFC fights end by KO or TKO. The decision rate sits at only 28.6%, the lowest of any division. Submissions account for most of the remaining 20% or so. The pattern is intuitive — heavyweight gloves carry a lot of force, defensive striking is harder to maintain at that mass, and even a half-landed punch from a 250-pound athlete will often end a round. The structural consequence for the bettor: heavyweight method markets should always lean toward KO/TKO, and heavyweight under-rounds lines should price short. When a bookmaker has not made the divisional adjustment cleanly — usually because the casual money has piled into the over on a “championship rounds” narrative — there is genuine value to find.
Flyweight is the mirror. The data: 24.6% of flyweight fights end by KO, 21.7% by submission, and roughly 53% go to the judges — the highest decision rate of any men’s division. The pattern here is also intuitive — flyweight athletes move at extraordinary speed, defensive striking is more sustainable at lower mass, and the lower base damage per shot means fights more often reach the final bell. The structural consequence: flyweight method markets should lean toward decision, and flyweight over-rounds lines should price short. The casual money tends to underweight this because flyweight gets less broadcast attention; the disciplined bettor exploits the gap.
The other divisions sit between these extremes, but not symmetrically. Light heavyweight and middleweight behave closer to heavyweight on finish patterns. Welterweight is the most “average” division — close to the global 53% finish rate with no strong skew. Lightweight tilts toward submission relative to the average. Bantamweight skews to decisions, though less extreme than flyweight. The women’s divisions follow broadly similar patterns to their men’s equivalents, with women’s flyweight and strawweight running high decision rates, and women’s bantamweight slightly more balanced.
The lesson for the bettor is to never treat “UFC” as a homogeneous product when you’re working a method or rounds market. The price the bookmaker is showing you has divisional adjustment baked in, but the quality of that adjustment varies between operators and between bouts. A bookmaker who priced the over-rounds line on a flyweight title fight at 1.91 has under-priced it relative to base rate; a bookmaker who priced the same fight at 4/7 has priced it close to the base rate. Reading these prices requires holding the divisional data in your head, not just the global 53%.
One operational note. When a heavyweight headlines a card, watch the casual-money flow into the over-rounds market as the fight approaches. Casual money chases narrative — “championship fighters protect themselves, this will go five” — and the over price typically tightens through fight week as that money piles in. The disciplined bet is the under, taken early when the casual money has not yet moved the line.
Favourite Versus Underdog: What 65% Actually Means
Across a 10-year UFC sample, favourites win between 65% and 70% of their fights. Underdogs win between 30% and 35%. That number is one of the most quoted statistics in UFC betting and one of the most misunderstood.

The misunderstanding starts with the assumption that backing favourites is therefore profitable. It is not. The favourite winrate is built into the price. A 65% to 70% favourite winrate corresponds to a moneyline in the 1.43 to 1.54 decimal range (4/9 to 8/15 fractional), and that is roughly the range where the average UFC favourite is priced. Backing every favourite at average odds for a year will deliver a winrate close to the historic 65%-70% band and a return on investment roughly at break-even minus the operator’s overround. The favourite winrate is descriptive of the average market; it is not an edge to exploit.
What is an edge is the divisional variation around that average. Men’s flyweight favourites since 2020 have won 77% of their fights — a 30-8-1 record that is the highest favourite winrate of any division. Heavy favourites (those priced at substantial chalk) win at around 80% across the same sample, regardless of division. The bettor who knows that flyweight favourites land 77% of the time is reading the market with information the casual bettor does not have, and that information disciplines the question “is this 4/6 favourite priced fairly”.
The complication is that the divisional patterns shift over time, and any cited percentage has a sample-size caveat. The men’s flyweight number of 77% is built on a sample of 39 fights since 2020 — small enough that one bad year could swing it noticeably. The heavyweight favourite winrate sits a little below the global 65%-70% band, in the 60% to 64% range, because the divisional finish patterns produce more variance in outcomes. So when you’re applying the favourite-winrate framework to a specific fight, you have to weight the divisional sample appropriately and not over-anchor on small numbers.
The underdog side of the equation is where the betting opportunity actually lives. Underdogs land 30% to 35% of their UFC moneylines on average, but the implied probability built into the underdog price is typically a few points lower than the historical hit rate. A 2/1 underdog has 33.3% implied probability. The historic underdog winrate of 30–35% sits at or just above that implied probability for typical “moderate dog” prices. So backing every underdog at moderate dog pricing across a year produces a small positive expected return — before overround, and assuming the divisional and stylistic mix is representative.
This is not a recommendation to blanket-back underdogs. The variance is enormous, the bankroll requirements are heavy, and the operator’s overround typically eats the edge on average pricing. But the underlying data tells you that the market consistently slightly under-prices underdogs across the long run, and the disciplined bettor who finds the spots where the under-pricing is structural rather than random has a path to genuine edge. The full data, with the divisional sample sizes, the time-windowed adjustments, and the staking framework, is in a dedicated UFC favourite versus underdog winrates breakdown.
Rematches And Title Defences: The Patterns That Repeat
Rematches in UFC produce a peculiar statistical pattern. Across a historical sample, the winner of the first fight wins the rematch 66% of the time — a record of 52 wins from 78 rematches. That number is higher than the casual narrative around rematches suggests, where the assumption is often that “the loser knows how to fix it” and adjusts in the rematch. The data says the opposite. Whoever won the first fight is meaningfully favoured to win the second.
The structural reason is that the first fight contains diagnostic information about how the matchup actually plays out. The skill differential, the stylistic interaction, the conditioning over the championship distance — all of these are revealed in the first bout. The winner has the easier preparation problem in the rematch (replicate what worked); the loser has the harder one (change something that didn’t work, while their opponent has the time to anticipate the change). The data backs the easier problem.
UK bookmakers tend to price rematches with a small adjustment toward the original winner but not at the full 66% implied probability — usually 55% to 62% depending on the time gap, weight changes, or other variables. That gap between the bookmaker’s implied probability and the historical rematch winrate is exactly the kind of structural edge a disciplined bettor looks for. It is not always there, and not always large, but it is there often enough to track.
Title defences are a separate pattern with its own statistics. Of the 19 underdog champions in UFC history — fighters who were priced as the underdog when they won their belt — 12 successfully defended at least once. That’s roughly 63%. The narrative around “underdog champions” is often that they got lucky and the next defence will expose them, but the data says most of them defend successfully. The statistical pattern reflects something real: an underdog who wins a championship has demonstrated capability the market underrated, and that capability does not vanish overnight.
For the bettor, both of these patterns translate into practical asks. When a rematch is coming up, the question is whether the bookmaker has priced enough adjustment toward the original winner. When an underdog champion is defending, the question is whether the market is over-correcting against him. Neither pattern produces guaranteed value, but both produce reliable starting points for analysis.
Tape Study And Recent Form: What Doesn’t Show On The Stat Sheet
The public statistics on a UFC fighter — significant strikes per minute, striking accuracy, takedown defence, control time — are useful baselines but they capture only part of what a tape study reveals. The serious work happens when you watch the last three or four fights and look for the patterns the numbers cannot describe.

The qualitative factors that move my reads. First: cardio across the championship distance. A fighter who fades in round three of a three-rounder is a different bet at five rounds, regardless of what his striking accuracy numbers say. Second: the weight cut profile. A fighter who has visibly struggled at the scales repeatedly carries water-cut risk into his next fight even if his record looks clean. Third: the camp change. A fighter who has moved gyms in the last six months is essentially a new athlete to evaluate; the public stats reflect the old camp’s training, not the new one’s. Fourth: the injury history. Cumulative damage from a hard fight three months ago does not show in any public stat sheet.
The stat sheet itself contains useful signals if you read it for context rather than headline numbers. Significant strikes landed per minute is meaningful relative to opponent strength — a high number against weak opposition is not the same as a moderate number against top-five competition. Takedown defence percentage is sensitive to the wrestlers the fighter has faced; a 75% rate against three pure strikers is different to a 75% rate against three NCAA Division I wrestlers. Striking accuracy is the most context-dependent of all because power, target selection, and exchange rate all interact with the raw percentage.
The most useful tape-study habit I’ve developed is to watch the last fight without sound and without commentary. Commentary biases your read because the commentators have access to the fighter’s narrative — the comeback story, the rivalry, the injury rumour — that you should be filtering for yourself. A silent rewatch lets you see the technical pattern: footwork, distance management, defensive responsibility, the specific exchanges that earned a stoppage or lost a decision. That technical read is what the public stats cannot give you.
The honest limit on tape study is time. Most UK bettors cannot watch five hours of fight tape on every card; the marginal return on the third or fourth hour drops off. My working rule is one fight of careful tape on each headline matchup and three to five minutes of highlight tape on each undercard fighter, with the public statistics doing the heavy lifting on the rest. The discipline is to not bet undercards I haven’t done the work on, regardless of how attractive the price looks.
Event Context: What Changes At UFC London
Event context is the statistical variable that most public-facing UFC data ignores. The same fighter, in the same physical condition, performing at UFC London with 18,629 British fans in the O2 Arena is a different statistical proposition to the same fighter performing in a half-empty Vegas studio. The home-crowd effect is real, measurable, and routinely under-priced by operators who treat every card as a neutral venue.

UFC London on 21 March 2026, Evloev versus Murphy, drew 18,629 fans and a gate of $4.52 million — comparable to the Edwards-Brady card from March 2025 which sold 18,583 tickets at a $4.71 million gate, then the highest-grossing UFC Fight Night in history. London is now a fixture on the UFC calendar precisely because the city delivers crowd energy and ticket revenue at a level few other markets match. Dana White said it directly: “London is one of the premier fight cities in the world. The fans are passionate, the energy is incredible and the last time we were there we broke the highest-grossing Fight Night record in UFC history.”
The statistical edge for British fighters at UFC London is documented across a long run of cards: home British fighters land a moneyline winrate roughly 3 to 5 percentage points above their expected winrate at non-UK venues. That is not enormous, but it is structural, and it is enough to push a price one or two ticks toward the home fighter relative to a neutral venue. UK operators are aware of this and tend to tighten home prices into fight week — but the casual money still skews further than the operator, leaving the disciplined bettor a small but consistent angle on the away fighter on undercards.
The other UK event-context factor is the prelim time slot. Because UFC events happen on London evenings rather than Vegas afternoons for the UK audience, the early prelims often air at hours that suit British fans (Saturday evening rather than the small hours), and the increased local handle on those prelims tightens prices relative to a US-time slot. This is a market-microstructure point, not a fighter-skill point, but it changes how lines move through the day.
Mapping Statistics Onto Markets You Can Actually Bet
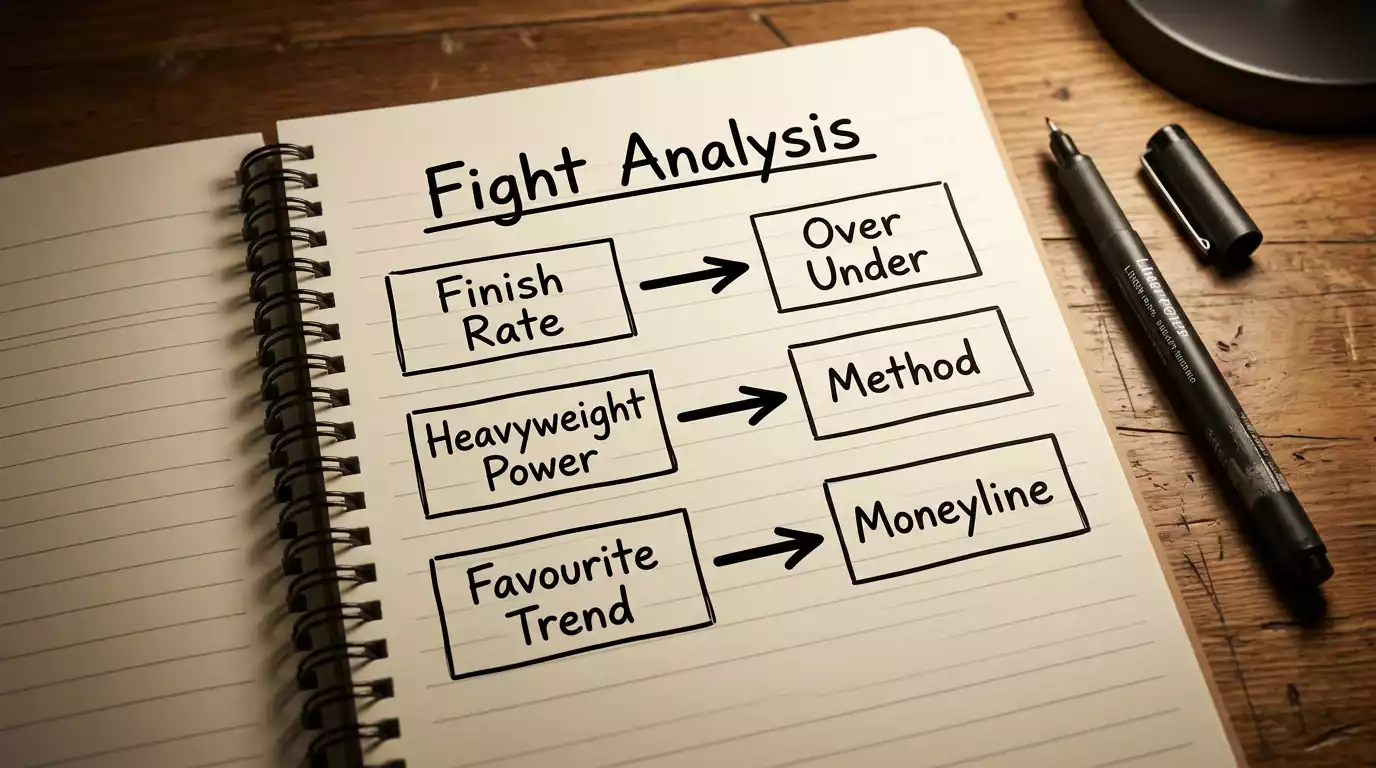
The closing exercise is to draw the explicit map from each statistic to the market it most cleanly disciplines. This is the toolkit assembly. Here is how I work it.
The global 53% finish rate disciplines the over/under rounds market on any individual fight. If the bookmaker has priced the under at 11/10 (52.4% implied), they are pricing close to the global base rate — which means they have not made a strong divisional or stylistic adjustment. Whether that pricing represents value depends on whether the specific matchup deserves a finish skew above or below 53%.
The 50% heavyweight KO rate disciplines method-of-victory pricing on every heavyweight bout. A heavyweight KO line priced at 11/4 is roughly 27% implied — and the divisional base rate suggests both fighters’ combined KO probability should approach 50% of the total, meaning each fighter’s KO probability is in the 25% to 30% range. So 27% is in band. A line at 7/2 — 22% implied — is below the divisional pattern and worth investigating.
The 24.6% flyweight KO rate disciplines distance-going prop bets and over-rounds markets on flyweight bouts. A flyweight over-rounds line priced longer than evens is signalling that the bookmaker thinks this specific matchup is more likely to finish early than the divisional average — which means a stylistic finishing pattern is being read into the bout, and the question is whether you agree.
The 65% to 70% favourite winrate disciplines moneyline pricing on every fight. A favourite priced at decimal 1.50 — 66.7% implied — is in the global average band. Tighter than 1.50 implies the bookmaker thinks this favourite is stronger than the modal UFC chalk; longer than 1.50 implies they think this is a slightly weaker-than-average favourite. The divisional refinement adjusts the band — flyweight favourites pricing in the 1.30 to 1.40 range is consistent with the 77% divisional winrate.
The 66% rematch winrate disciplines pricing on any sequel matchup. The bookmaker’s implied probability on the original winner should sit between 55% and 66%; anything materially below 55% is opening daylight for the original-winner side, anything materially above 66% is asking you to pay a premium without strong recent-form justification.
The mapping does not produce automatic bets. It produces investigations. Each price that sits at or near the base-rate band is “in market”, and you need a specific read to act on it. Each price that sits materially off the base-rate band is anomalous, and the question becomes whether the anomaly is justified by a specific stylistic or news factor or whether the bookmaker has simply priced lazily.
The Pitfalls Of A Headline Stat
Every statistic in this article carries a sample-size caveat that the headline number hides. The 77% men’s flyweight favourite winrate is built on roughly 40 fights since 2020 — small enough that two unlucky months would visibly compress the number. The 66% rematch winrate is built on 78 historical rematches, which is a decent sample but still vulnerable to a few high-profile reversals shifting the perception. The 53% finish rate is the most robustly sampled statistic in the article — thousands of fights — but even that figure has shifted by 2 to 3 percentage points across different eras of the sport as the talent base has evolved.
The structural pitfall is overconfidence. A bettor who reads “men’s flyweight favourites win 77%” and concludes that backing every flyweight favourite is automatic value is missing the variance. The variance on a 40-fight sample with 77% point estimate is wide enough that the true population parameter could plausibly be anywhere from 65% to 85%. The point estimate is the best read; it is not the whole truth.
The second pitfall is the windowed cherry-pick. Statistics quoted with phrases like “since 2020” or “in the last 18 months” should always be checked against the longer-run sample. A pattern that exists in the last 18 months and not in the prior 5 years is more likely a temporary regime than a durable structural truth. The disciplined bettor weights long-run data more heavily than recent data, with recent data informing tactical adjustments rather than driving the strategic frame.
The third pitfall is sampling bias on “recent form”. A fighter’s last five performances are not a representative sample of his ability — they are a sample of his ability against his last five specific opponents in his last five specific circumstances. A 5-0 streak against weak opposition is genuinely different from a 5-0 streak against top-five contenders. The shortcut of “in form” or “out of form” hides the opponent-quality dimension entirely.
The honest application of statistics is therefore probabilistic, not deterministic. Each number gives you a starting band, with uncertainty around it, and the disciplined read is to ask whether the bookmaker’s price sits inside the plausible band you’ve derived from the data. When it does, you have no action. When it sits materially outside, you have an investigation. When the investigation reveals a structural reason for the anomaly — divisional, stylistic, news — you have a candidate bet. That entire sequence is what separates a bettor who uses statistics from a bettor who quotes them.
Which UFC weight class is the most favourite-friendly for moneyline bettors?
Men’s flyweight, by some distance. Favourites in the men’s flyweight division have won approximately 77% of their fights since 2020 — a record of 30-8-1 in the available sample. That is well above the global UFC favourite winrate of 65% to 70%, and it reflects the divisional pattern where decisions are common (around 53% of flyweight fights) and the skill differential at the higher end of the division is wider than in heavier classes. The sample is small, however, so apply the number with appropriate uncertainty.
Does the finish rate apply equally to UFC women’s divisions?
No. The global 53% finish rate is dominated by the men’s data simply because the men’s divisions contribute more fights to the sample. Women’s flyweight and women’s strawweight both have decision rates above the global 47%, with women’s flyweight in particular running at decision rates close to 60%. Women’s bantamweight is closer to the global average. As with the men, the divisional adjustment matters more than the global number on any specific fight.
How recent should UFC fighter stats be before I trust them for a bet?
The last three to five fights provide useful directional context, particularly on cardio, weight cut profile, and stylistic interaction with current opposition. Older fights matter for foundational metrics like takedown defence and striking accuracy, but they need to be weighted against the strength of the opposition at the time. The single biggest sampling trap is treating a five-fight streak against weaker opposition as equivalent to a five-fight streak against top contenders — they are not.
Published by the bet on ufc Fight team.