
UFC Fighter Research Methodology UK: Betting Stats
 Available in US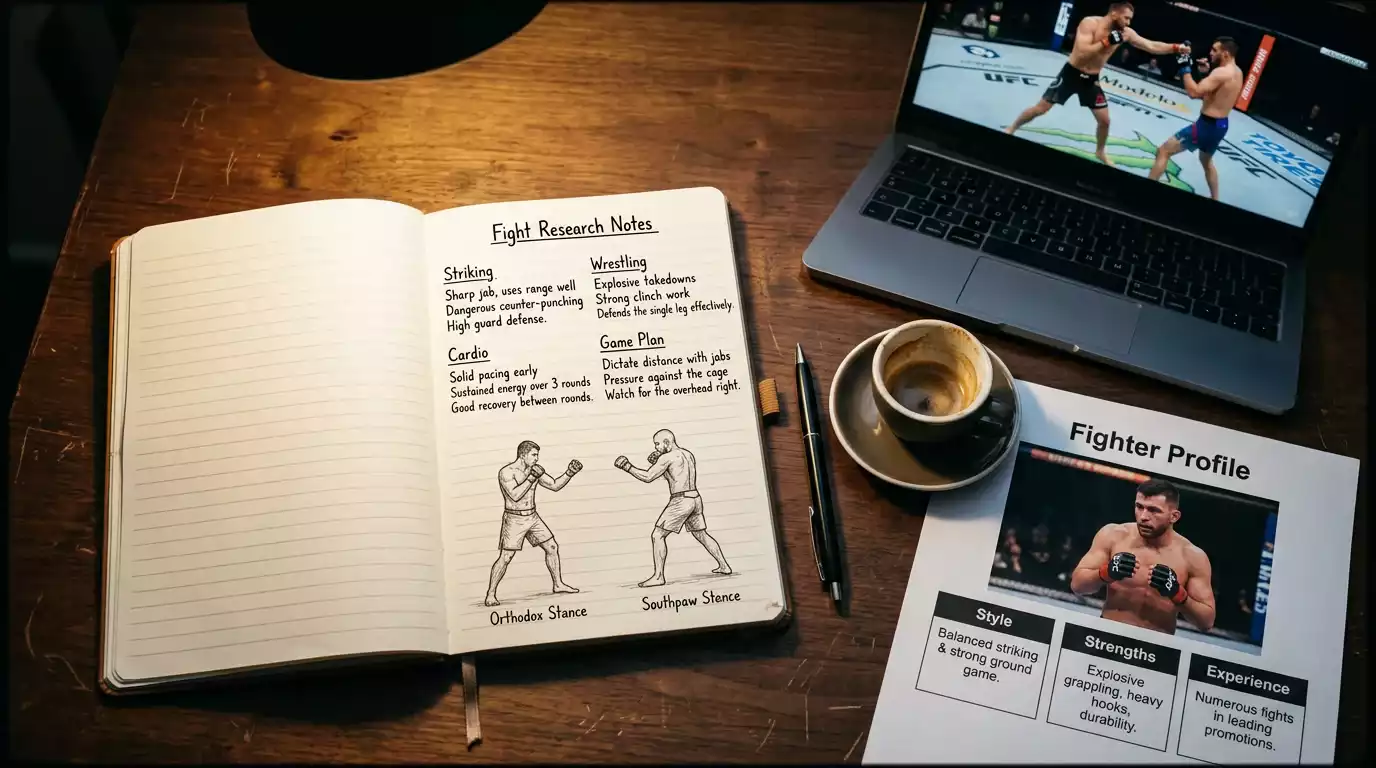
Executing a 7-Point UFC Pre-Fight Research Checklist
The bets I’m proudest of aren’t the ones that won. They’re the ones where I did the work, articulated a specific read, sized the position appropriately, and then took the result — win or loss — as data rather than as outcome theatre. That distinction is the whole point of having a ufc fighter research process: not to be right more often, but to be wrong for defensible reasons and to learn from each fight in a way that compounds.
The casual approach to UFC betting is a few hours of YouTube highlights, a glance at the headline records, and a feeling about who’s coming in hot. The casual approach is exactly what the market is priced against. Operators have access to dozens of paid data feeds, professional analyst time, and pricing models that integrate hundreds of variables. The casual bettor’s edge against that machinery is, by definition, vanishingly small.
What this piece offers is a process that’s accessible to a UK amateur but rigorous enough to find the specific edges that operators leave on the table. We’ll cover the core metrics that should anchor every pre-fight profile, how to use tape efficiently, the intangibles that statistics can’t capture, the cases where data is misleading, and a seven-point checklist that should become routine.
The metrics that anchor every profile
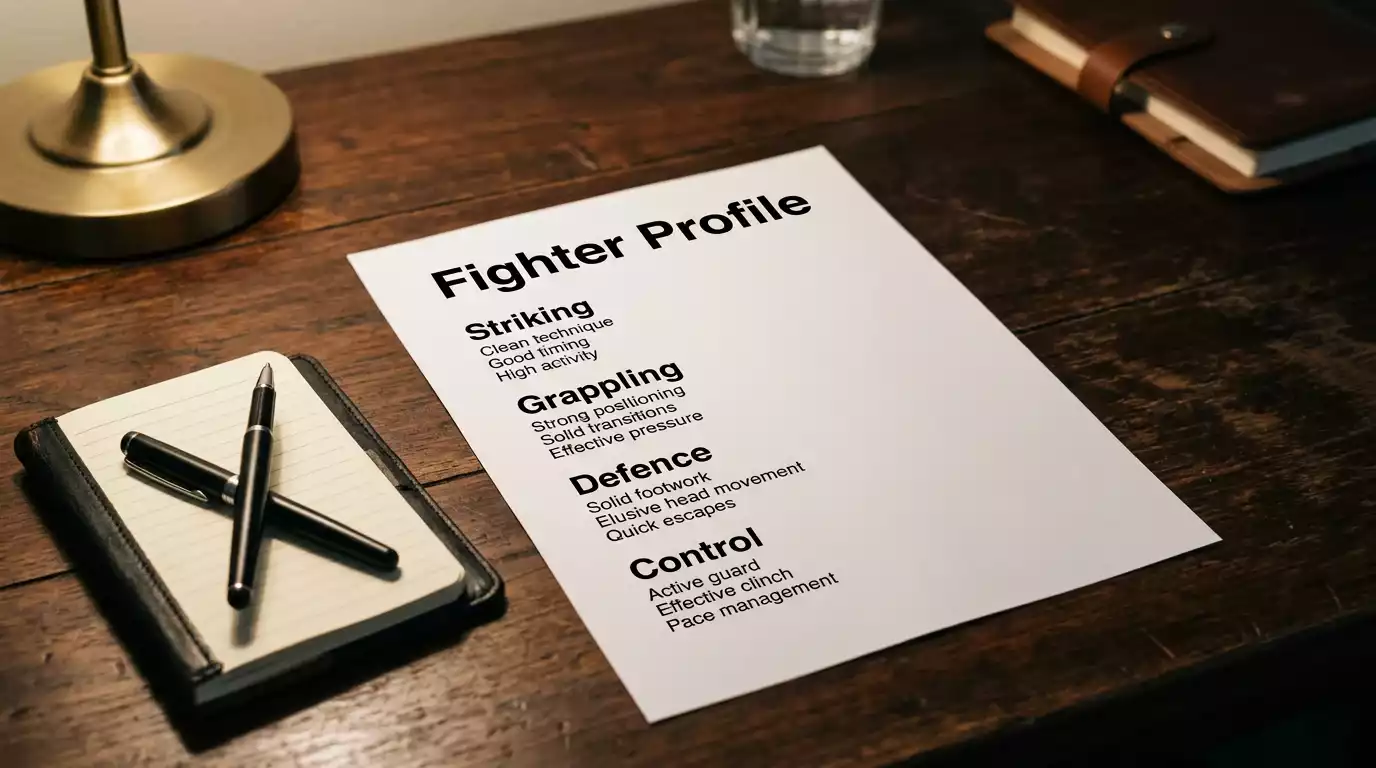
Five metrics carry most of the weight in any pre-fight analysis: Significant Strikes Landed per Minute (SLpM), Significant Strike Accuracy, Significant Strike Defence percentage (the inverse of strikes absorbed per minute), takedown defence percentage, and submission attempts per 15 minutes (Sub Att/15). These five numbers are publicly available, consistently tracked across fighter careers, and they capture the bulk of what predicts outcomes in MMA.
SLpM tells you how much offensive work the fighter generates. At UFC level, ranked fighters typically run between 3.5 and 6.5 per minute, with division-specific norms — lighter divisions trend higher. A fighter consistently below 3.0 is either an extremely defensive striker or someone whose offensive output simply doesn’t keep pace with judges’ scoring criteria.
Significant Strike Accuracy captures how cleanly the offensive work lands. Career figures of 45 to 55% are normal for ranked strikers; above 55% indicates a fighter who picks his shots carefully or holds clear technical advantages over his opposition; below 40% suggests volume without precision, which tends not to translate into decision wins against quality opposition.
Strike Defence — typically expressed as a percentage of opponent strikes avoided — is the metric most often overlooked. A fighter at 65% defence is keeping a meaningful margin between himself and his opponent’s offence. A fighter at 50% or below is taking nearly as many strikes as he throws, which compounds in five-round fights and across cards.
Takedown defence is the swing metric for striker-versus-grappler matchups. A fighter at 80%+ TDD largely neutralises wrestling offence; one at 50% or below is essentially conceding the grappling matchup. Watch for sample-size issues — a fighter who’s only faced two takedown attempts has a TDD percentage that means nothing.
Submission attempts per 15 minutes captures grappling aggression separately from outcomes. A fighter with 1.5 sub attempts per 15 is actively hunting; one at 0.5 or below is wrestling for position rather than for finishes. The metric reads finish potential better than the headline submission-win count.
Tape study: the last three fights rule
Tape study is where most casual punters either skip the work entirely or overdo it watching a fighter’s career highlight reel. Neither helps. The right approach is focused: the fighter’s last three fights, watched with specific questions in mind, takes maybe 90 minutes of total time and produces more usable insight than ten hours of highlight reels.
The questions that matter: How does the fighter open the fight? Does he establish his preferred range immediately or feel out the opponent? What’s his transition pattern between striking and grappling — does he wrestle off failed strikes, does he grapple as a primary tool, does he avoid the mat entirely? How does he respond to adversity — pressure, takedown attempts, body shots? What does his cardio look like in the championship rounds (or final round of a three-rounder)?

The last three fights specifically because fighters evolve. A 2022 tape on a fighter who’s since changed camps, recovered from injury, or moved up a weight class isn’t representative. The last three give you the current version of the man — his current toolkit, his current cardio, his current weaknesses. Older fights are reference material; recent fights are evidence.
Skim, don’t watch full fights. Use round-by-round highlight cuts to spot the patterns, then watch the specific exchanges that matter to your read. If your hypothesis is “Fighter A’s takedown defence has eroded in the last year”, you watch his recent takedown defence sequences specifically — maybe 8 to 12 minutes of tape total. That focused study gives you a defensible read without consuming the whole evening.
The intangibles statistics can’t see
Numbers and tape catch most of what matters, but a meaningful slice of UFC outcomes is driven by intangibles that the data either doesn’t track or doesn’t track well. Camp changes are the biggest. A fighter switching from a low-output camp to a major MMA gym (or vice versa) often shows a dramatic change in performance, and the timing of the change matters — first fight at a new camp typically shows improvement in some areas and regression in others, as the fighter integrates new techniques while abandoning familiar patterns.
Weight cut history is the second major intangible. A fighter with documented difficult cuts — particularly missed weight or visible struggles on the scale — is carrying a hidden physical cost into the fight that the moneyline often doesn’t reflect. Look for the cut narrative on each fighter: how often have they missed weight? Have they recently moved up or down a division? Are they making the weight comfortably or by visibly fasting in the final 36 hours?
Injury status is harder to read because fighters and camps strategically obscure it. The signals that emerge — withdrawals from training partners, social media silence in the weeks before the fight, missed press obligations — are weak signals, but they accumulate. A fighter with three weak signals in the eight weeks before the fight is more likely to be physically compromised than the public narrative suggests.
Coaching changes during camp are a specific subcategory. A fighter who fires his striking coach two months before a fight is signalling that he or the camp believes the striking game needs a fundamental shift, which rarely happens cleanly in eight weeks. The same applies to switches in grappling coaches or strength-and-conditioning programs.
When the data lies
Statistics in MMA can deceive in specific, recurring ways, and recognising the patterns is part of mature analysis. The first deception is small samples. A UFC fighter with five career bouts has metrics that may swing wildly on his next fight; treating those numbers as predictive at the same confidence level as a 20-fight veteran’s metrics is a basic error.
The second deception is opposition quality. A fighter whose 70% takedown defence was earned against three opponents with combined wrestling backgrounds of one high-school season is not a 70% TDD fighter against an elite wrestler. The metric needs to be weighted by the level of opposition that produced it, and that weighting isn’t part of the publicly available number.

The third deception is style mismatch within the metric. A fighter with high SLpM against pressure strikers will often show lower output against counter-strikers, because the rhythm of the fight changes. The metric reflects the historical sample of his opponents; the upcoming opponent may pull a different number out of him entirely.
The fourth, and most important, is the divisional pattern. Around 53% of UFC men’s fights end early — 33.3% by KO/TKO, 19.7% by submission — but those rates vary dramatically by weight class. Applying cross-divisional baselines to a specific fight without adjusting for the divisional context produces misreads. The same applies to favourite winrates: UFC favourites win 65 to 70% across the population, but the rate at flyweight is closer to 77% and at heavyweight closer to 60%. Treating “the favourite wins 65%” as a universal constant rather than as a population average is the kind of statistical sloppiness that costs money over volume. Building this kind of context-aware reading is exactly what the broader work in UFC fight statistics betting develops in depth.
The seven-point pre-fight checklist
The full research process distils into a seven-point checklist that should be reproducible across every fight you bet. Run it methodically and the analytical work compounds; skip steps and the gaps will appear in your results.
One: identify the divisional context. Which weight class, what are the divisional finish rates and favourite winrates, and what does this matchup look like relative to the divisional norm? Two: pull the five core metrics for each fighter (SLpM, accuracy, defence, takedown defence, sub attempts) and compare against divisional baselines. Three: watch the last three fights from each man, with specific questions in mind — opening patterns, transitions, response to adversity, cardio. Four: identify the matchup signature — striker versus striker, striker versus grappler, grappler versus grappler, pace versus power. Five: list the intangibles — camp changes, weight cut history, injury signals, coaching shifts. Six: form a probability estimate for who wins and how. Seven: compare your probability estimate to the implied probability on the moneyline and method markets, and identify where the gap justifies a bet.

The discipline is to actually run all seven steps, in order, before reaching for the bet slip. The temptation is to skip from step two (the headline stats) to step seven (place the bet) and rationalise the analytical work as already done. It isn’t. Steps three through six are what convert the public information into a defensible read, and they’re the steps the casual punter doesn’t run.
The practice that compounds across a season
Done once on a single fight, this research method is more work than the bet justifies. Done routinely across a season — even just on the main events of each card you bet — the analytical depth starts compounding. You build a personal library of fighter profiles. You start spotting patterns that the broader public narrative misses. You develop intuition for when a line is mispriced versus when the price reflects something you don’t see.
The 2026 UFC calendar features 13 PPVs and around 30 Fight Nights, which is enough volume to make a structured research practice meaningful but not so much that you can’t run the full process on the fights that matter to you. The honest threshold is: if you’re not going to do the work, don’t bet the fight. The market is efficient enough at UFC level that unanalytical betting is a steady leak. Either commit to the process and find the value, or take the fight off as entertainment rather than a betting opportunity. Trying to occupy the middle ground — placing bets without the research, hoping the casual approach hits — is the most expensive habit in the sport.

How many recent UFC fights should I tape-study before betting on a fighter?
Three is the practical sweet spot. The last three fights give you the current version of the fighter’s toolkit, recent cardio, and recent response to different matchup types. Going deeper than three usually starts including fights from an older version of the same fighter — different camp, different weight, different physical condition. Going shallower than three increases sample-size variance and risks missing a one-off bad night or one-off good night that wasn’t representative.
Where do UK bettors find verified UFC fight stats for free?
The official UFC website publishes most career statistics for every active fighter, including SLpM, accuracy, defence, takedown defence, and submission attempts per 15 minutes. UFC.com is also the source most operators use as their underlying data feed, so the numbers you’ll see on your sportsbook’s inline stats are typically consistent with the official UFC source. Third-party MMA stat aggregators like Tapology and Sherdog provide supplementary data, though formats and definitions vary across sites.
Written by the editors at bet on ufc Fight.